A very limited number of surveys ask questions about the preferred textile for ITNs. These include Madagascar 2016, Liberia 2016, Sierra Leone 2016, and Rwanda 2017. (A 2013 survey in Madagascar also contains this question but is not included here). With the data about respondent preferences, we can assess whether textile preference is associated with whether a particular net is used the night before the survey.
How the question is asked is important
While all surveys included a “Don’t know” option for the question about textile preferences, only Liberia and Madagascar included an option for “no preference” in their survey questionnaires. We recommend that future surveys include an option for “no preference” when asking about preferences for net attributes (textile, color, shape, etc), as it provides an important indication of the strength of these preferences. Expressing a preference for a certain material does not necessarily mean that individuals will not use nets of the other material, as the rest of this website shows.
In Rwanda, the question about the preferred material was asked for each net in the household. Of the 4205 households in the survey, only 32 households reported different preferences for the nets within their household; the rest (99.3%) had consistent preferences for one type or the other. The data shown here has collapsed these preferences from the net level to the household level so that the unit of analysis for all four surveys is the household. In the future we would recommend that surveys ask the preference questions at the household level, not the net level, as the net-level question does not provide any additional insights.
What are the textile preferences in each country?
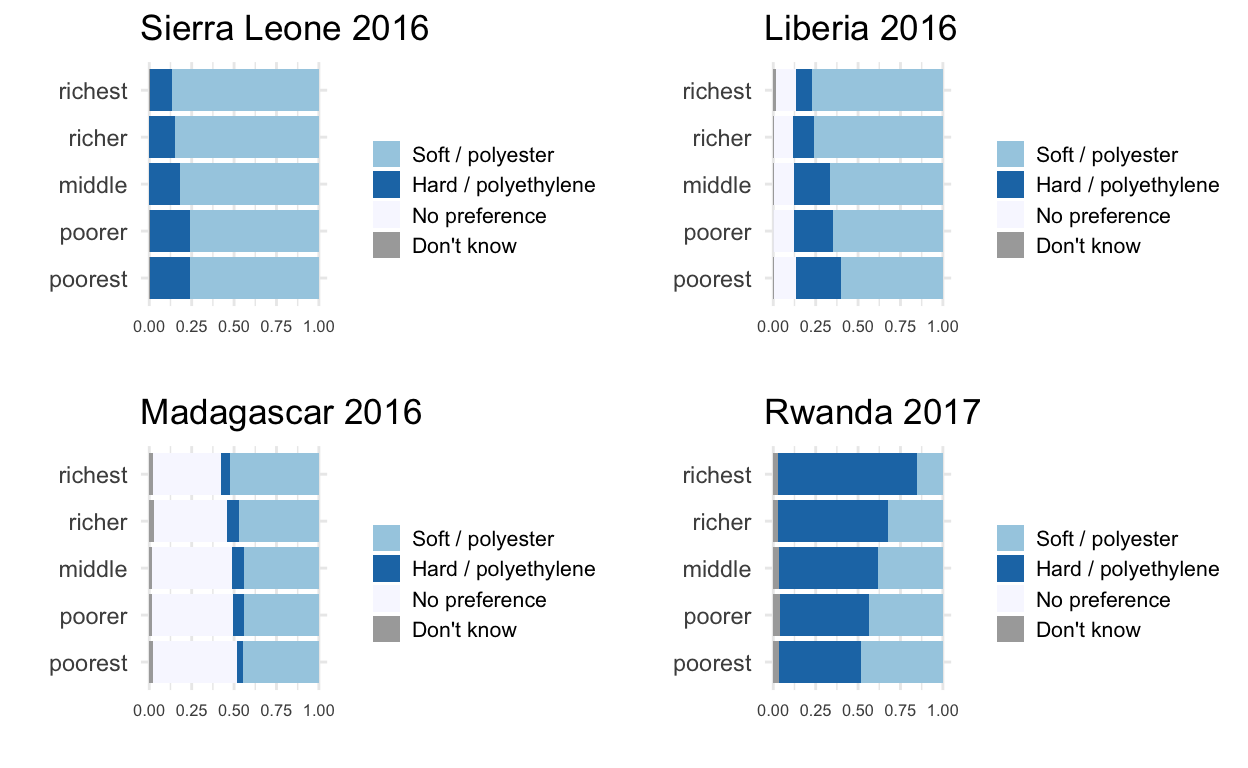
Preferences tend to vary by wealth quintile, so let’s take a look at preferences for net textile for each country, stratifying by wealth quintile. Sierra Leone and Liberia look similar, with most respondents preferring polyester nets, highest for respondents in the richest quintiles. In Madagascar, around half of respondents had no preference, and most of the rest preferring polyester, with some small differences by wealth quintile. In Rwanda, the majority prefer polyethylene nets: from about half of all poorest households, to over 80% of the richest households.
Figure 1: Reported preferences for net material by wealth quintile
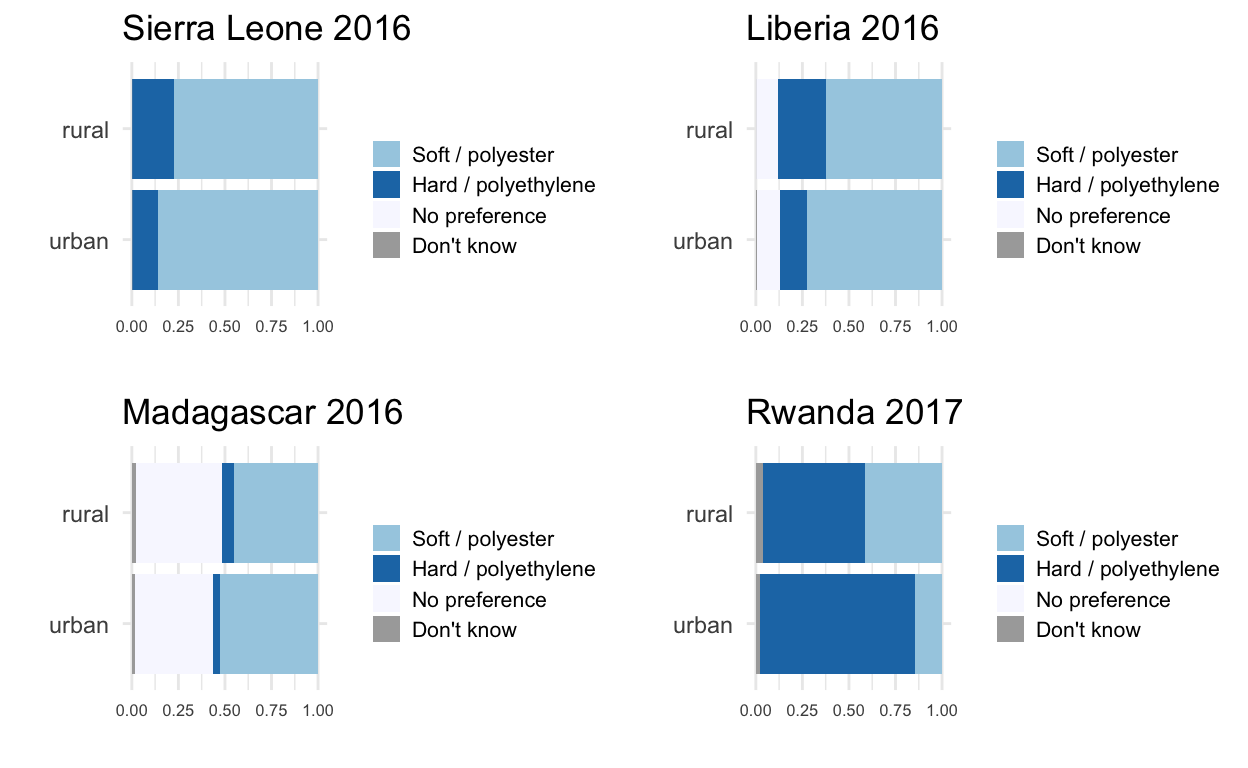
We see a similar pattern when stratifying by urban/rural residence. Sierra Leone and Liberia have more preference for polyester in urban areas, and slightly less in rural. Urban areas in Rwanda prefer polyethylene to a greater degree than rural areas.
Keep in mind that those in the richer wealth quintiles and/or urban areas tend to have access to more options for acquiring nets, and may have more agency to act on their preferences for certain net types. Households in rural areas and those in the lower wealth quintiles have limited options for acting on their preferences, and thus may feel they have to make do with whatever options are available.
Figure 2: Reported preferences for net material by residence
Are the current nets the preferred textile?
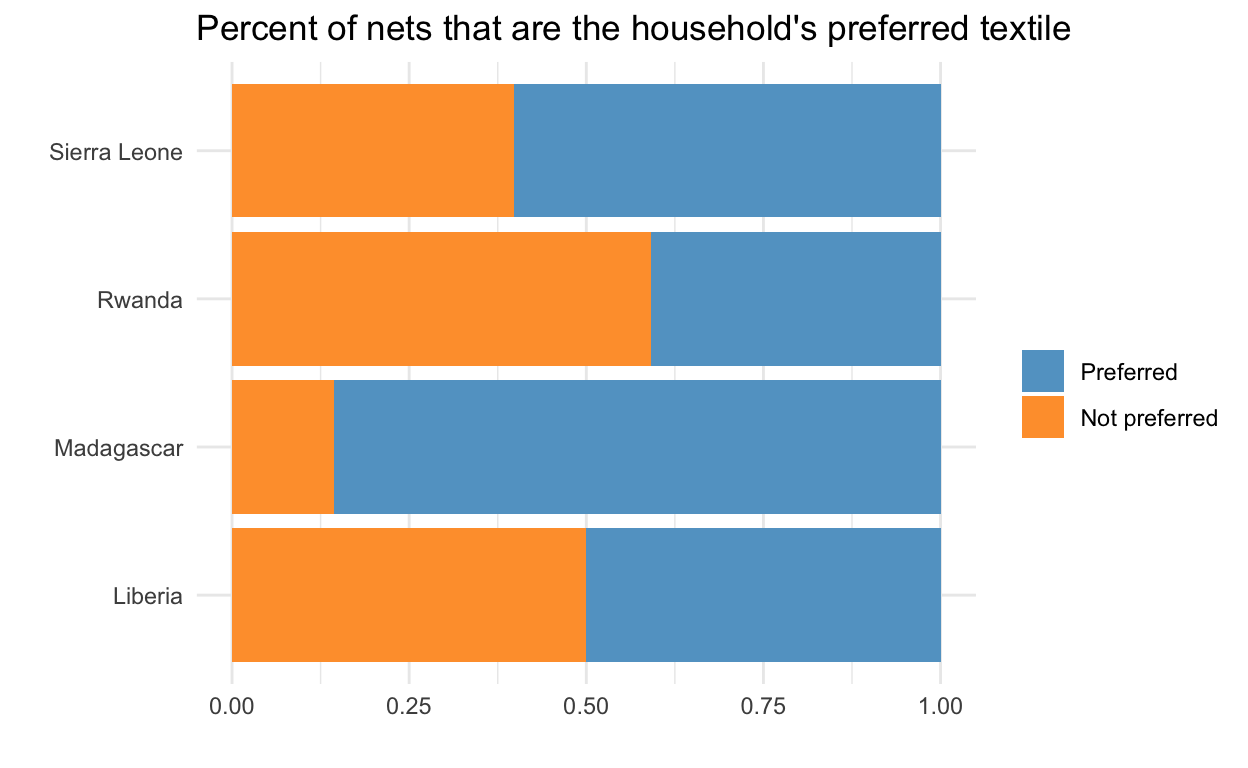
We can see in the graph below that in Madagascar, the majority of nets during the 2017 survey were the preferred textile, and that in Sierra Leone and Liberia, around half of all nets were the preferred textile. Slightly less than half of all nets in Rwanda 2017 were the preferred textile.
Figure 3: Proportion of nets that are the household’s preferred textile
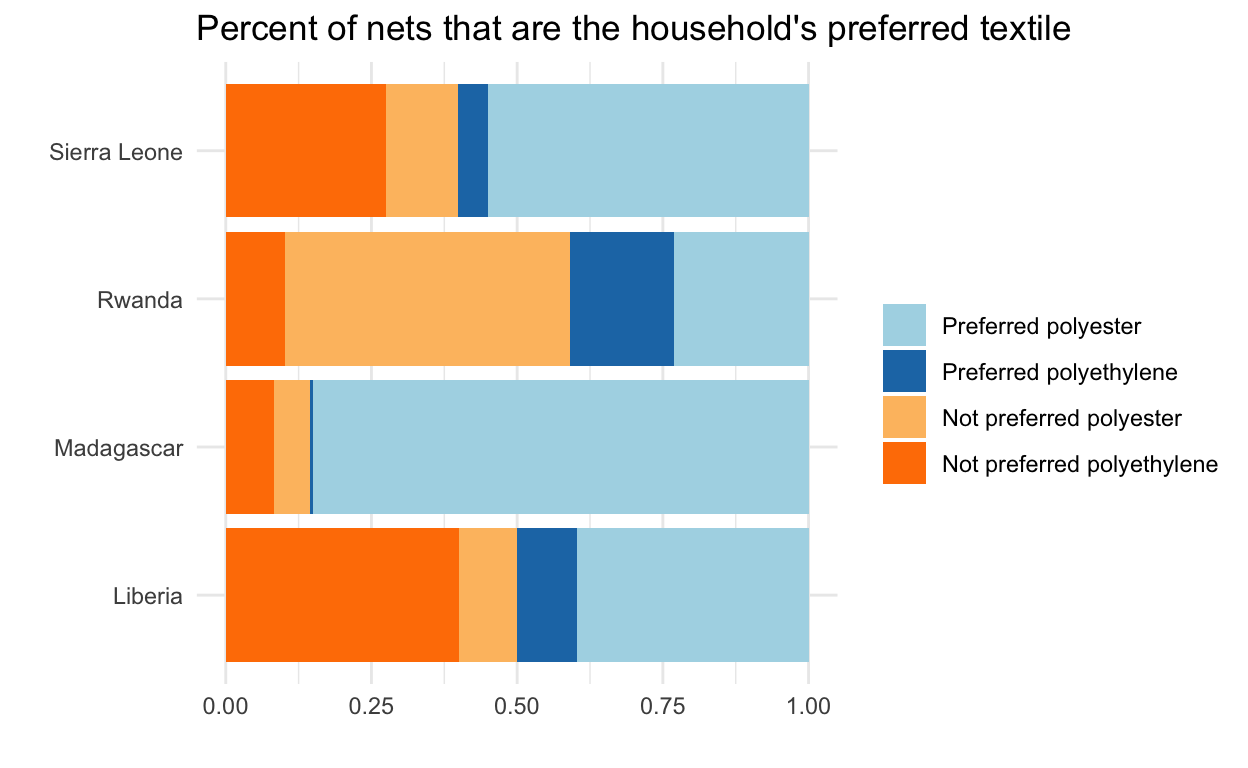
We can break this chart down further into specific categories for preferred and not-preferred nets of the two textiles. In Rwanda 2017, the preferred nets were split more or less evenly between the two textile types, although we can still see in the light orange bar that the majority of nets were polyester nets owned by households that would have preferred polyethylene.
Figure 4: Proportion of nets that are the household’s preferred textile, by type
Regression models - is preference associated with net use?
The below table summarizes the results of generalized linear models to assess the associations between textile preference and the likelihood of a net being used the previous night. We have created a variable from the reported preference and the textile of the net - a binary variable indicating whether a net in the household is the preferred textile or not. Only in Liberia 2016 is this variable significantly associated with the odds of a net being used the previous night - nets of the preferred textile were 1.39 times more likely to have been used than those that were not the preferred textile, controlling for the other factors in the model.
The model also shows us that the household net supply - whether they have not enough nets, the right number of nets (at least 1 per 2 people, but less than one net per person), or ‘too many’ nets (1 per person or more) is strongly associated with the likelihood of net use in all models.
| Characteristic | Madagascar 2016 | Liberia 2016 | Sierra Leone 2016 | Rwanda 2017 | ||||||||
|---|---|---|---|---|---|---|---|---|---|---|---|---|
| OR1 | 95% CI1 | p-value | OR1 | 95% CI1 | p-value | OR1 | 95% CI1 | p-value | OR1 | 95% CI1 | p-value | |
| preference | ||||||||||||
| not preferred textile | — | — | — | — | — | — | — | — | ||||
| net is preferred textile | 1.17 | 0.93, 1.48 | 0.2 | 1.39 | 1.14, 1.69 | 0.001 | 0.96 | 0.75, 1.21 | 0.7 | 0.92 | 0.81, 1.06 | 0.2 |
| household net supply | ||||||||||||
| not enough | — | — | — | — | — | — | — | — | ||||
| just right | 0.30 | 0.23, 0.39 | <0.001 | 0.49 | 0.35, 0.68 | <0.001 | 0.39 | 0.30, 0.50 | <0.001 | 0.77 | 0.62, 0.95 | 0.017 |
| too many | 0.08 | 0.06, 0.11 | <0.001 | 0.14 | 0.10, 0.18 | <0.001 | 0.17 | 0.12, 0.25 | <0.001 | 0.29 | 0.23, 0.37 | <0.001 |
| month of interview | 1.38 | 1.17, 1.62 | <0.001 | 1.33 | 0.99, 1.79 | 0.059 | 1.30 | 0.89, 1.90 | 0.2 | 1.24 | 1.05, 1.47 | 0.012 |
| region | 1.03 | 1.01, 1.05 | <0.001 | 0.95 | 0.85, 1.05 | 0.3 | 0.82 | 0.72, 0.94 | 0.004 | 0.98 | 0.90, 1.06 | 0.6 |
| type of place of residence | ||||||||||||
| urban | — | — | — | — | — | — | — | — | ||||
| rural | 1.19 | 0.80, 1.76 | 0.4 | 0.69 | 0.44, 1.08 | 0.10 | 0.88 | 0.62, 1.24 | 0.5 | 1.09 | 0.82, 1.44 | 0.6 |
| wealth index combined | ||||||||||||
| poorest | — | — | — | — | — | — | — | — | ||||
| poorer | 0.93 | 0.73, 1.17 | 0.5 | 1.07 | 0.81, 1.41 | 0.6 | 0.73 | 0.52, 1.03 | 0.074 | 0.92 | 0.75, 1.13 | 0.4 |
| middle | 0.87 | 0.66, 1.16 | 0.3 | 0.99 | 0.73, 1.33 | >0.9 | 0.63 | 0.47, 0.83 | 0.001 | 1.11 | 0.91, 1.34 | 0.3 |
| richer | 0.88 | 0.66, 1.17 | 0.4 | 0.66 | 0.41, 1.04 | 0.074 | 0.73 | 0.50, 1.06 | 0.10 | 1.01 | 0.80, 1.27 | >0.9 |
| richest | 1.35 | 0.97, 1.86 | 0.071 | 0.43 | 0.27, 0.69 | <0.001 | 0.33 | 0.21, 0.52 | <0.001 | 1.25 | 0.98, 1.61 | 0.077 |
| net age (months) | ||||||||||||
| 0- | — | — | — | — | — | — | — | — | ||||
| 12- | 1.00 | 0.63, 1.60 | >0.9 | 0.73 | 0.58, 0.93 | 0.011 | 1.37 | 0.91, 2.06 | 0.13 | 0.94 | 0.78, 1.13 | 0.5 |
| 24- | 0.91 | 0.59, 1.42 | 0.7 | 0.70 | 0.46, 1.08 | 0.11 | 1.09 | 0.79, 1.51 | 0.6 | 0.93 | 0.70, 1.23 | 0.6 |
| 3+ years | 0.64 | 0.45, 0.93 | 0.018 | 0.66 | 0.42, 1.04 | 0.072 | 1.12 | 0.79, 1.59 | 0.5 | 0.55 | 0.40, 0.75 | <0.001 |
| 1 OR = Odds Ratio, CI = Confidence Interval | ||||||||||||