This website provides reports for countries in sub-Saharan Africa to evaluate whether there are differences in use of insecticide-treated nets (ITNs) due to the textile of ITNs (i.e. polyester or polyethylene).
Some countries may wish to procure ITNs of a particular textile. These reports use large household survey data to evaluate whether there are differences in use between polyester and polyethylene nets in a particular country, and whether net textile is associated with these differences after controlling for other determinants of net use.
These reports walk through several key questions to ask as we consider this question and provide recommendations for next steps.
In four countries, publicly available surveys have collected information on household preferences for net textile. This data is summarized on the Preferences page.
This work is supported by the Alliance for Malaria Prevention with funding from The Bill & Melinda Gates Foundation.
Summary
Data from the most recent MIS, DHS, and MICS were obtained with permission from dhsprogram.com and mics.unicef.org. We plot several maps below of relevant indicators. We want to look at a few key questions:
- How big are any differences in use between polyester and polyethylene nets?
- If both nets are used at largely the same rates, the choice of textile is unlikely to be a major consideration for procurements
- What is the contribution of textile to net use after controlling for other factors?
- Many other factors influence net use decisions; textile is only one. It can be closely related to net age, for example, if an earlier campaign was one type and the most recent campaign a different type. It’s important to control for these factors to assess whether textile remains important predictor of net use. If it is not an important predictor, programmes can feel comfortable procuring both types of nets.
- Are the findings above consistent?
- If there is both a difference in the use rate between textiles, and textile is an important predictor after controlling for other factors, it may be worthwhile to explore further. If the findings above are contradictory, programmes can feel comfortable procuring both types of nets.
- How complete is net textile information?
- It’s good to confirm whether the data about net textile is complete; if a large percentage of nets are missing information, we should feel less certain about the overall results.
- Do countries have a mix of nets, or predominantly one type?
- It’s also good to check whether countries have predominantly one type of net, as this can potentially skew some of the results above.
- What’s happening at the regional level?
- National level results can mask regional variation. Currently we present regional results within the country reports and for selected countries on this page. Additional regional-level results are currently in development.
- What is the overall trend across countries?
- Results can be combined from multiple countries to assess the overall trend in net use as a function of textile.
- How big are the differences in use between PE and PET nets?
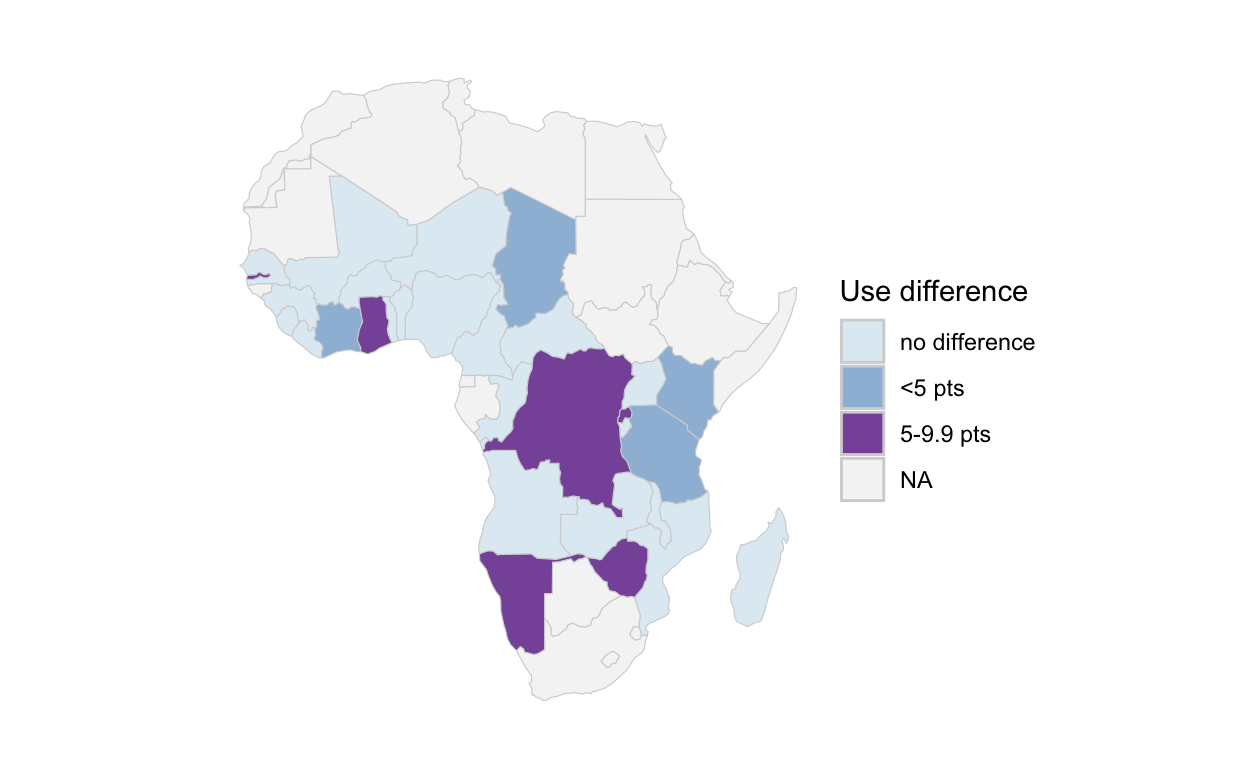
Figure 1 presents the crude (absolute) difference between the proportion of polyester nets used the previous night and the proportion of polyethylene nets used the previous night. In nearly all cases this difference is less than 10 percentage points and the majority of recent surveys show no significant difference in the overall use rate of nets of different textiles.
Figure 1: Crude difference in % of nets used between textiles
- Is textile an important predictor of net use after controlling for other factors?
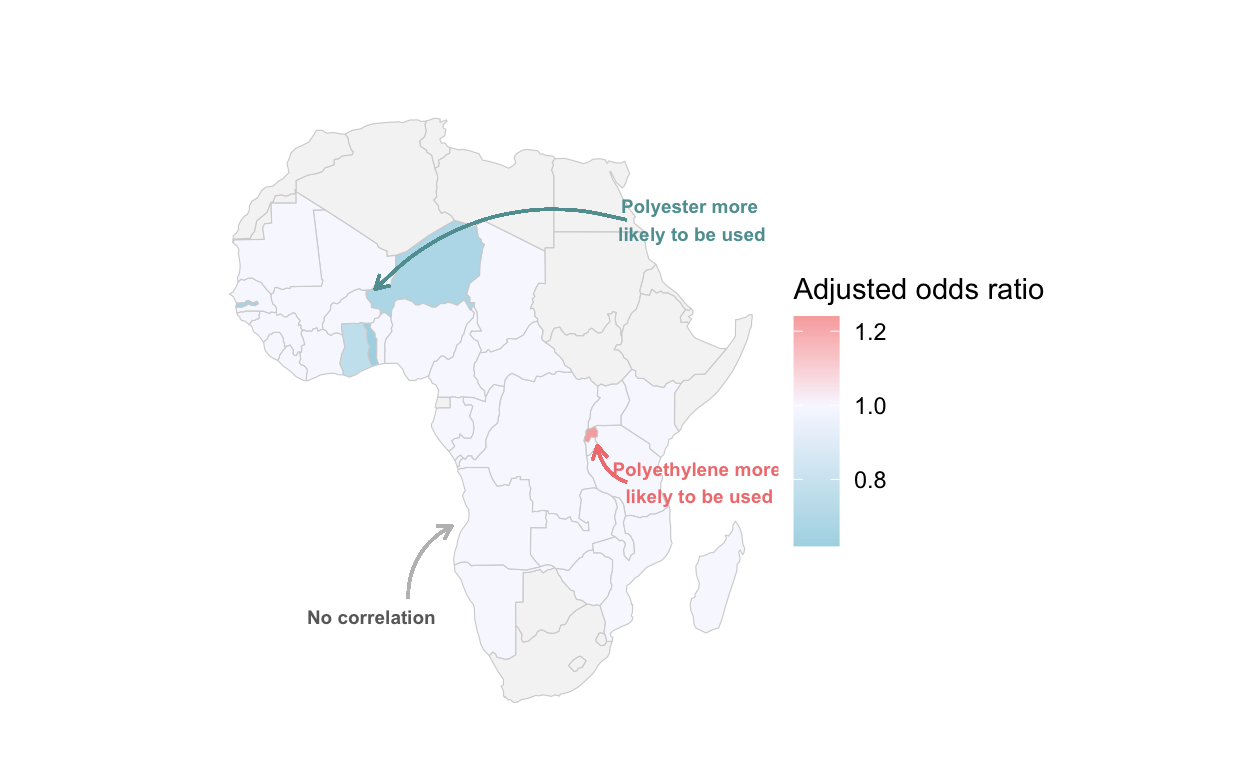
Figure 2 summarizes countries where the most recent survey shows a correlation between the textile of a net and whether it was used the previous night. In most countries, textile is not significantly correlated with use when controlling for other key factors, such as the household’s net supply (# of nets and # of family members), the month of the survey (seasonality), region, urban/rural, and wealth quintile.
Figure 2: Correlation of textile with use: adjusted for household supply of nets, net age, region, wealth, urban/rural, net age, and month
- Are the findings above consistent?
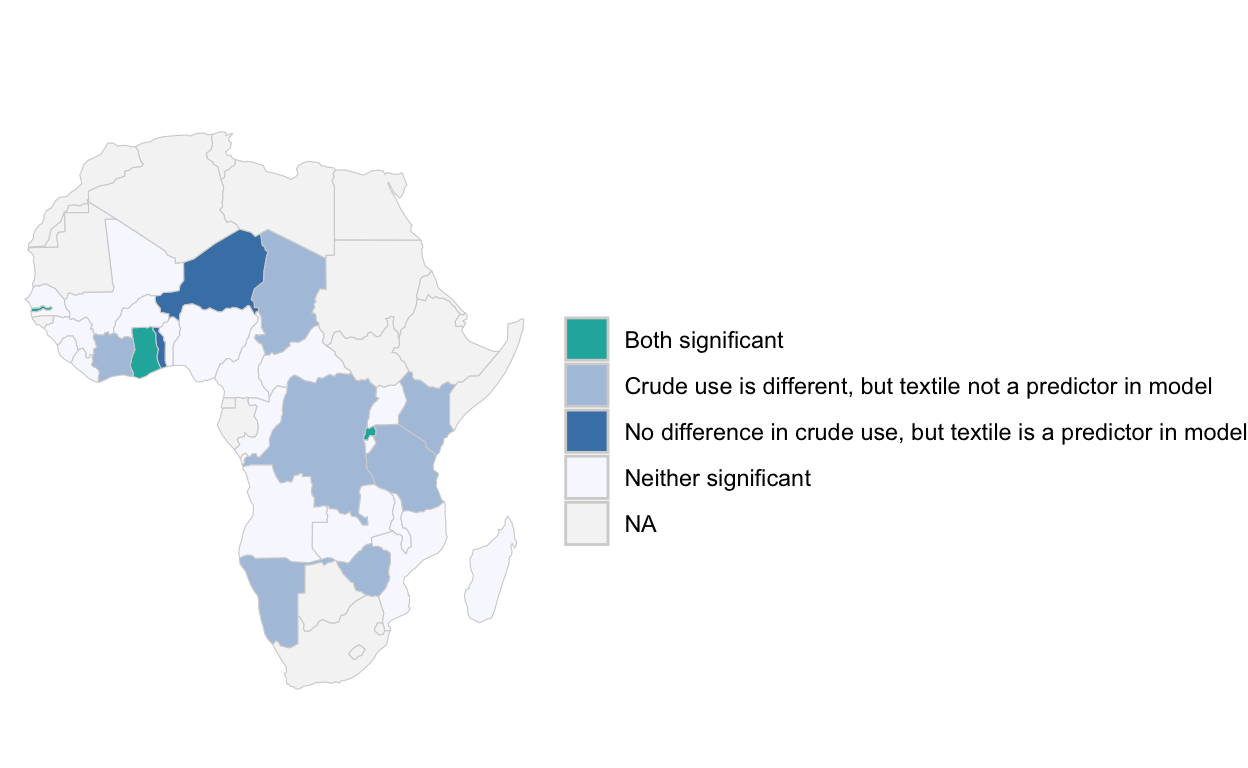
The results from Figures 1 and 2 can frequently be contradictory. A country like DRC shows a crude difference in the percent of nets used of between 5-10 percentage points - but textile is not a significant predictor of use in the multivariate regression model. Conversely, Togo has no difference in the crude use rate for nets of different textile, but when controlling for background factors, textile is significantly associated with use. The map below summarizes which countries have these ‘inconclusive’ findings, and for which countries both the crude use rate differences and the model results are telling the same story. In these countries, further exploration is warranted.
Figure 3: Crude and adjusted results
- How complete is the information we have for net textile in these surveys?
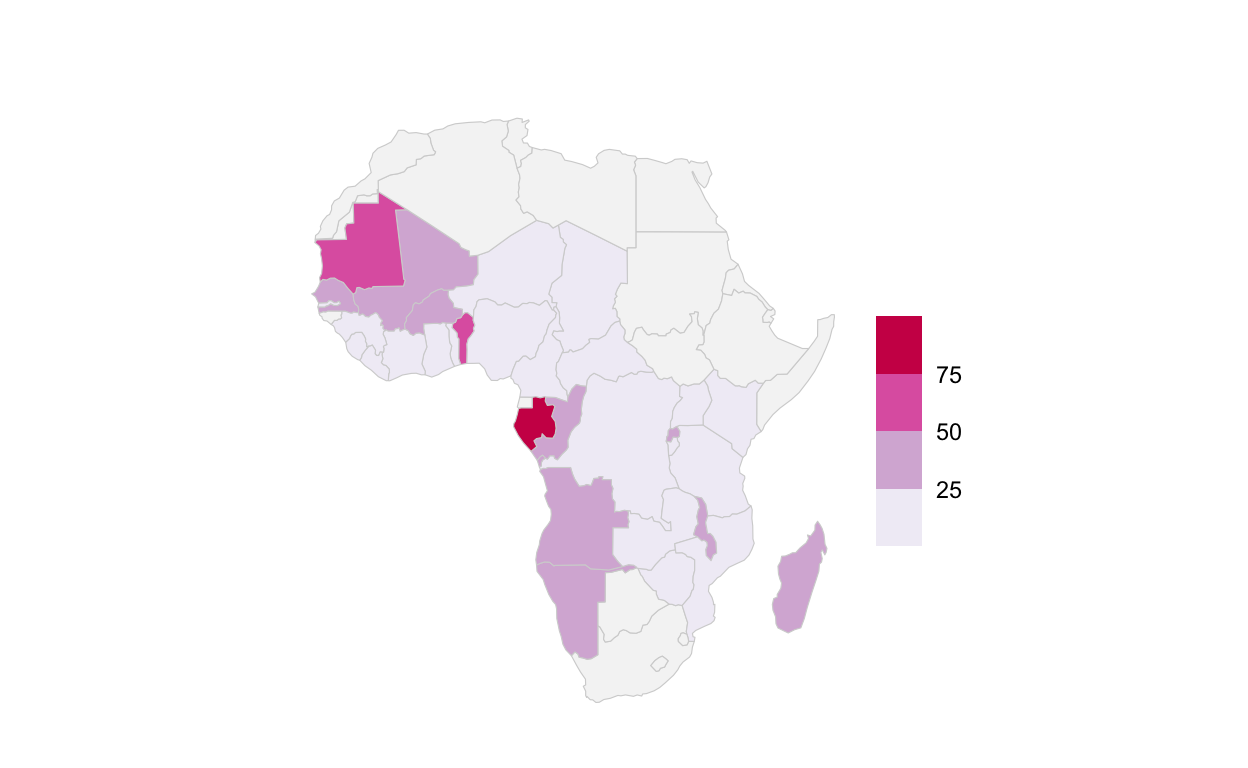
The textile is determined from the brand information collected in the survey; in some surveys the proportion of nets with an unknown brand can be considerable. Figure 4 summarizes the proportion of nets with an unknown brand and thus an unknown textile. This provides important context when interpreting results above.
Figure 4: Proportion of nets with unknown brand & textile
- Do countries have primarily one type of net, or a mix?
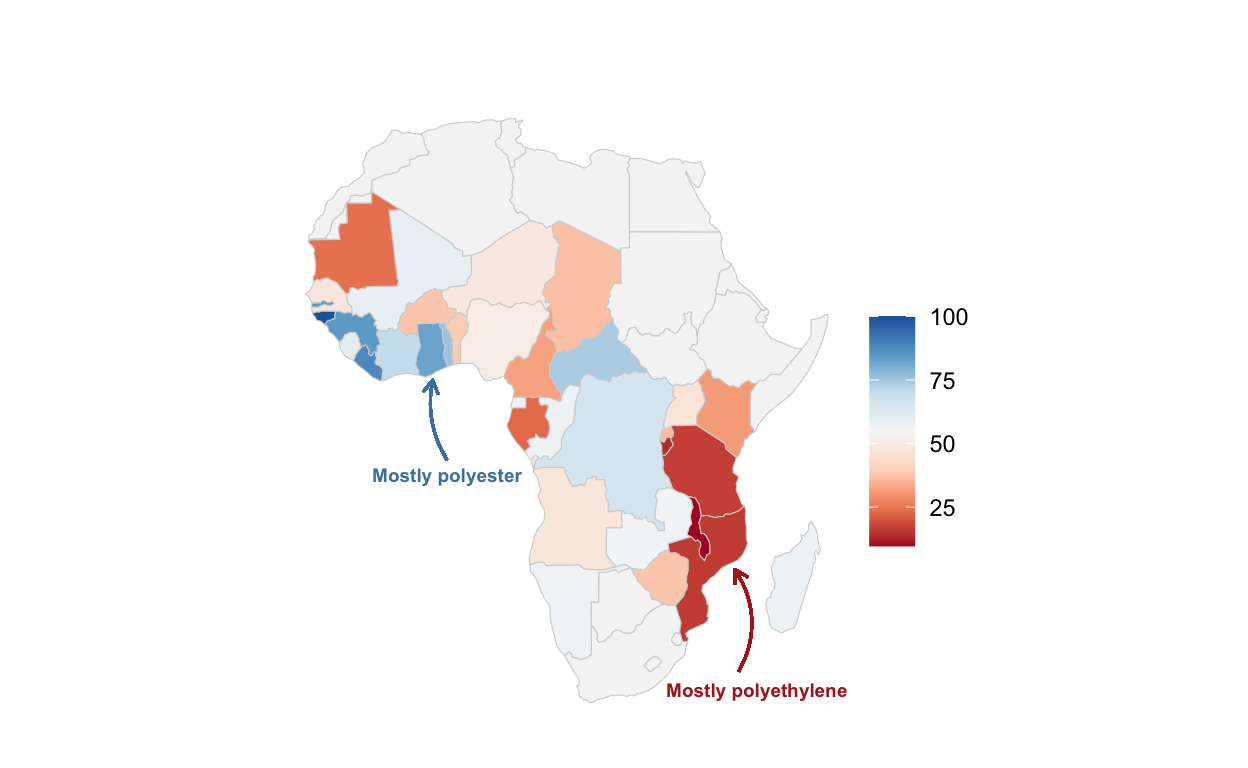
Figure 5 illustrates the relative share of polyester and polyethylene nets within countries - darker reds indicate a high proportion of polyethylene nets, and darker blues indicate majority polyester nets. It’s important to keep in mind this is from the time of the most recent survey; the picture may be different if the survey has a high percentage of nets with an unknown brand (see above), and if a country has conducted a mass campaign since the survey.
Figure 5: Proportion of nets that are polyester
- Watch out for in-country variation!
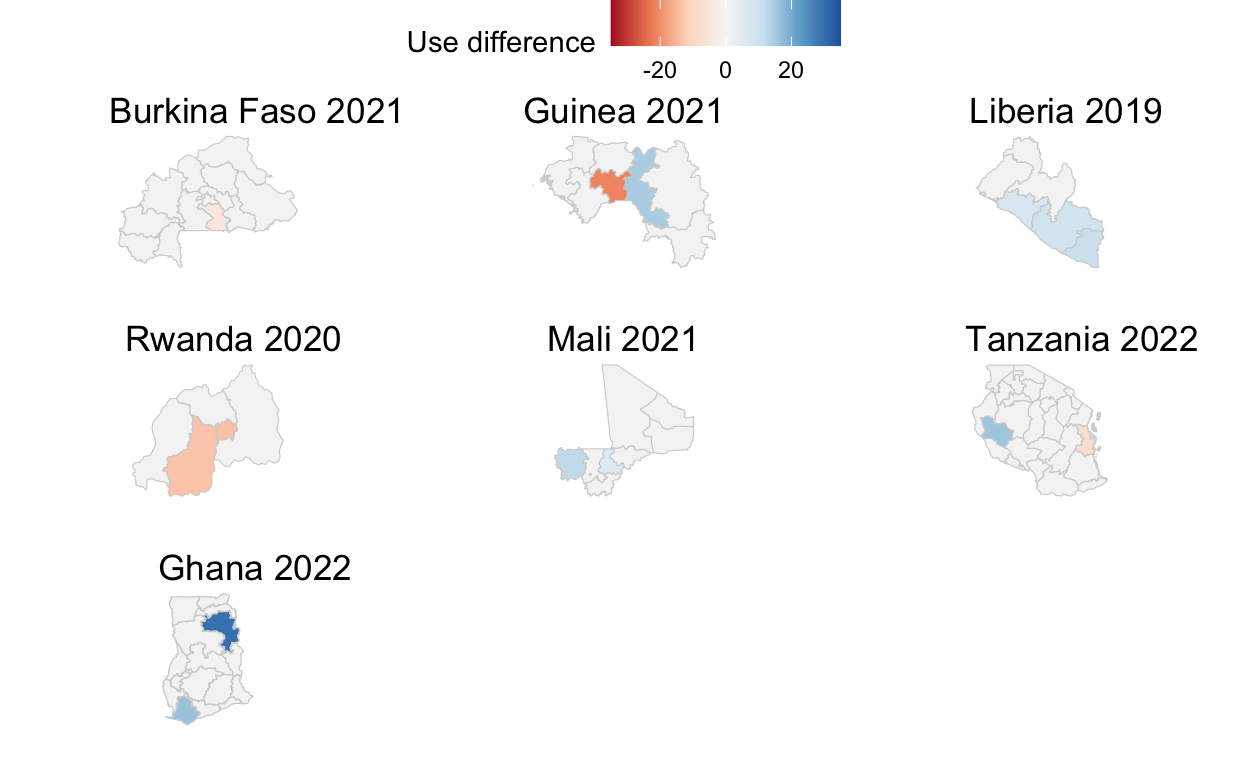
The below graphs present data on the difference in the percent of nets used the previous night for regions within seven countries where, in at least one survey, both the crude use rate shows a sizeable difference between textiles, and the multivariate regression model indicates textile is significantly associated with use. We can see that large parts of Burkina Faso have no observable difference in use between textiles, while one region leans towards polyethylene nets. For Guinea, the region in the middle of the country shows a slightly higher use of polyester nets. Likewise in Tanzania and Ghana (both 2022), crude differences in use appear in only one or two regions. But remember that net age is not accounted for here - differences in use could be because certain regions of the country have newer nets of one type, and have discontinued use of older nets of the other type.
Figure 6: Regional maps of the crude difference in polyester vs polyethylene net use. Blue indicates more polyester nets are used than polyethylene nets; red indicates more polyethylene nets are used.
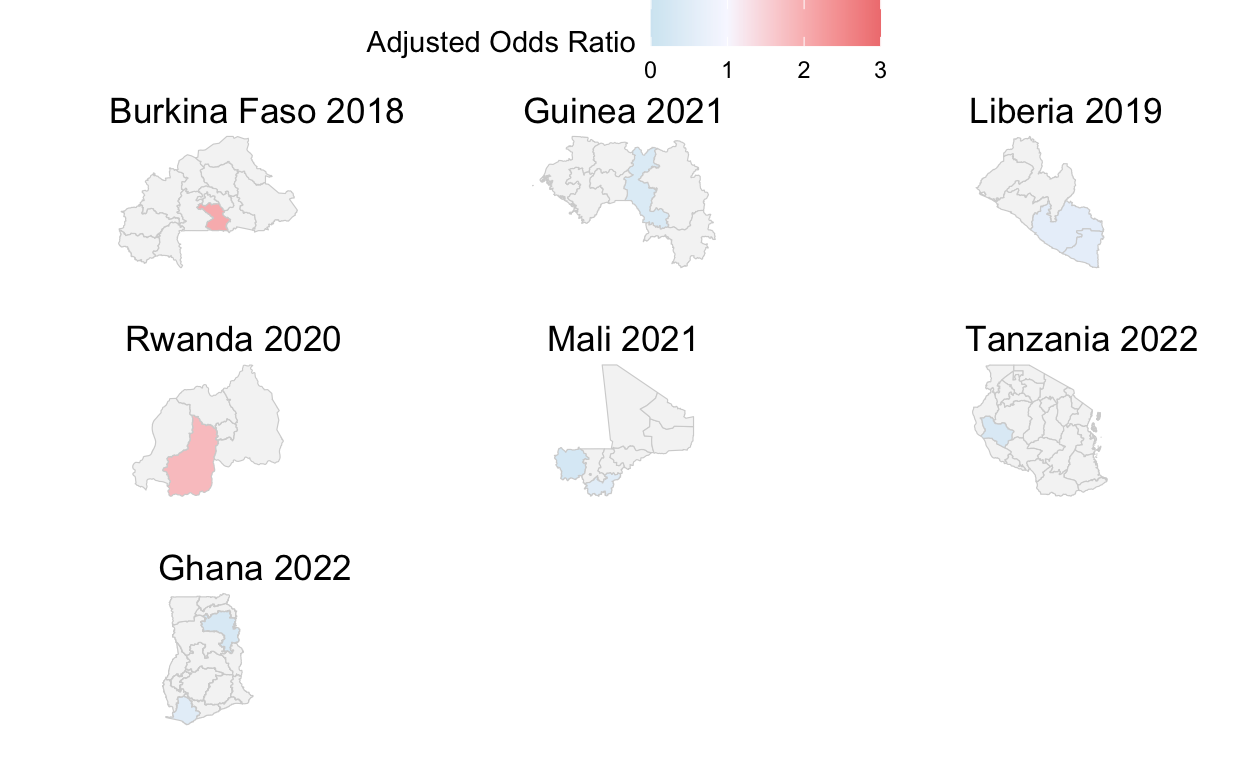
The seven maps below show the results of the multivariate model for each region, controlling for net age, household net supply, wealth quintile, and survey month. Blue regions are where polyethylene nets are less likely to be used (around half as likely in some regions of Ghana, Guinea and Liberia, compared to polyester), while red regions are where polyethylene nets are more likely to be used (up 2-3 times as likely in some parts of Burkina Faso and Rwanda).
Figure 7: Regional maps of the coefficient for textile in the adjusted model at regional level. Blue indicates polyethylene nets are less likely to be used than polyester nets; red indicates a higher likelihood that polyethylene nets are used.
- Meta analysis across countries
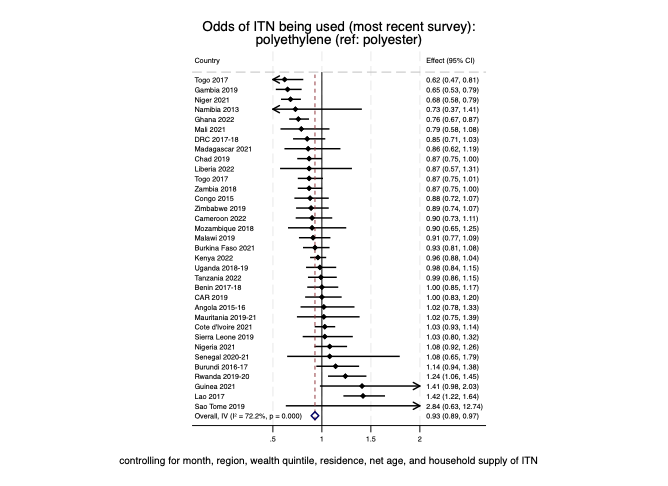
This forest plot summarizes the regression results for all available surveys, restricted to the most recent survey for each country. The bottom line shows that overall, polyethylene nets are only slightly less likely to be used the night before compared to polyester nets (adjusted odds ratio: 0.94, 95% CI 0.90-0.98) when controlling for background factors.
Figure 8: Forest Plot summarizing odds of a PE net being used; most recent survey per country
- Conclusions
From the findings above, most countries should feel comfortable that both polyester and polyethylene nets are used at similar rates. While people have preferences about textile, it appears that other factors are more important when deciding to use nets. Distribution of nets of the less-preferred textile is unlikely to lead to significant reduction in use. At subnational level, preferences can likewise vary. National programmes should continue to procure ITNs that respond to the insecticide resistance profile within their country as a top priority. Regional-level findings can be used to inform distribution planning when procurements contain both types of textile.